·Research·Futures·Market Microstructure·Contract Roll
What the Futures Contract Roll Does to Liquidity — and What It Does Not
We measured the quarterly and monthly contract roll on six futures markets, using tick data and a preregistered design. The roll is a large, measurable liquidity event in index futures — and three of the four things we tested came back negative, including the out-of-sample test on crude oil.

Every futures contract expires, and the open interest has to move to the next one. For the trader the roll is a scheduling problem: a week where the chart shows one contract and the volume is somewhere else. For the market it is something more specific — a period in which the liquidity of one instrument is temporarily split across two order books.
That is a measurable claim, so we measured it. This note reports what we found across six markets, including the parts that did not work. Three of the four questions we asked came back negative, and one of the negatives is the most interesting result in the set.
Everything below was preregistered: the statistic, the window, the direction of the hypothesis, the null distributions, the controls and the abort conditions were written down and frozen before any of it was computed. Where reality contradicted the plan, we say so rather than quietly adjusting.
The setup
We define the roll around an exogenous anchor A — a date fixed by the contract specification years in advance, never a date derived from the data:
| Market | Anchor A | Roll cycle | Rolls measured |
|---|---|---|---|
| ES, NQ, YM, RTY | Third-Friday expiry | Quarterly | 48 / 34 / 28 / 27 |
| ZN | First Notice Day | Quarterly | 48 |
| CL (WTI crude) | Last trading day | Monthly | 88 |
Around each anchor we take a 16-day window: a core of A−5 to A, and a flank of A−12 to A−6 as the comparison. Within each day we work in 30-minute buckets of the regular session.
The measurement itself is Kyle's lambda — the slope of price change against signed order flow, computed on the mid-price. In plain terms: how far does the price move per contract traded? Higher means the market absorbs less size. Crucially, we compute it on both contract legs at once and weight them by volume, because the whole point is that the liquidity is in two places.
The headline statistic is the log ratio of core to flank, averaged over rolls:
Λ = mean over rolls of ln( lambda in the core / lambda in the flank )
Λ greater than zero means each contract traded moves the price more during the roll week than the week before. That direction was fixed in advance, and it is one-sided.
One detail that motivated the whole exercise: a conventional chart-based study never sees this. In our own frozen dataset of 3,094 trading days, zero carry more than one contract — the front month, by construction. The second leg had to be computed from raw tick data specifically for this work.
Result 1: the roll is a large liquidity event
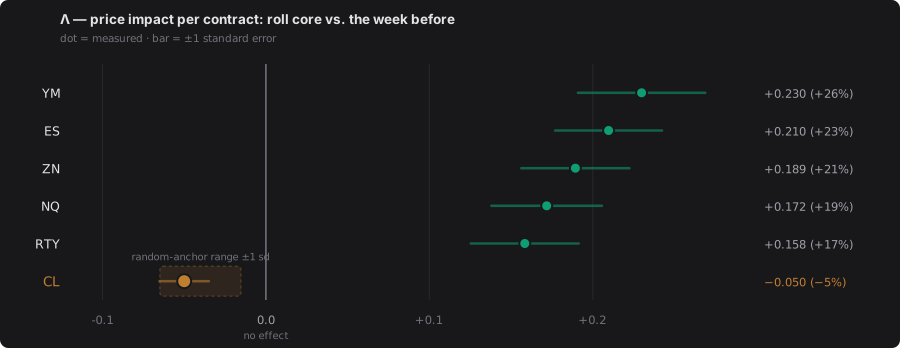
Λ per market, with ±1 standard error. Five markets sit far above zero; WTI crude sits inside the range the same statistic produces at random dates.
In the five days up to the roll, the average contract traded moves the price 17 to 26 percent more than in the preceding week:
| Market | Λ | Standard error | As impact | Rolls |
|---|---|---|---|---|
| YM | +0.2299 | 0.0390 | +26 % | 28 |
| ES | +0.2097 | 0.0327 | +23 % | 48 |
| ZN | +0.1894 | 0.0331 | +21 % | 48 |
| NQ | +0.1718 | 0.0338 | +19 % | 34 |
| RTY | +0.1584 | 0.0330 | +17 % | 27 |
All five clear every null distribution we built — random anchors drawn from the same calendar, with and without a blocking rule around the real rolls — at the resolution floor of 10,000 draws. A placebo run at A−42, in the middle of the contract cycle, lands at or just below zero in every case (−0.085 to +0.004), which is what it should do: the core/flank split does not manufacture a positive result on its own.
What that significance is worth, though, is less than it looks. The null we reject rules out window placement and the long-run drift in lambda. It does not rule out the arithmetic of a splitting pool. Given that volume migration in the same window is a 16-to-34-sigma event, rejecting the null was close to a foregone conclusion. The information in this result is in the size of the number, not in the p-value.
Two caveats belong here rather than in a footnote. First, ZN's roll is its month end — the First Notice Day is the last business day before the delivery month, in all 48 cases — so ZN cannot separate "roll" from "month end" at all. Second, a stricter variant of the calculation that requires both legs to be valid in every bucket leaves ES essentially unchanged (+0.220 against +0.210) but drops ZN by 35 percent, from +0.189 to +0.123. Up to a third of the ZN number may be an artifact of how thin legs enter the average.
Result 2 (negative): we cannot say how much of it is real
The obvious follow-up: is the roll actually worse than the split alone implies, or is the whole effect the mechanical consequence of dividing a pool?
We modelled it explicitly. If lambda scales with the size of a book, then splitting volume across two books raises the volume-weighted average by a predictable amount, and what is left over is the interesting part. The interesting part does not survive.
In ZN, where the decomposition is identified under the bounds we set, no residual remains. In ES it is not identified at all — the elasticity estimated in the core and in the flank differ too much for the split to be attributed.
The one result that looked strongest here also failed on inspection. Measured on the expiring contract alone, impact rises by +122 percent into the roll core, in 48 out of 48 ES rolls. That sounds immune to any splitting argument, since there is only one book in it. It is not: the expiring contract's own volume collapses during those days, and depending on the elasticity assumed, that size effect alone explains anywhere from 38 to 152 percent of the rise.
What remains is descriptive and robust, and we state it as such: in the expiring contract, price impact rises sharply in the roll core while its volume drains away. That is a description of the migration seen through impact — not an independent finding.
Result 3 (negative): no tradable signal in the calendar spread
If a large, forced, one-directional flow hits a market on a known schedule, the natural question is whether it pushes prices. We tested it on the calendar spread — the price difference between the two contracts, which is where a roll is actually executed.
The design: measure the direction of the roll flow over A−8 to A−5, then measure the spread change over the following days, with no overlap between the two windows. If the flow pushes the spread, the two should line up.
They do not:
- ES: −1.76 ticks ± 1.08 — the wrong sign, against a shuffled-flow null of +0.02 (p = 0.95).
- ZN: −0.02 ticks ± 0.35 — nothing at all.
The most informative number is not either of those. It is that the sign of the roll flow — "buying the new contract, selling the old" — appears in 49 percent of ES rolls and 56 percent of ZN rolls. A coin flip. The forced flow leaves no consistent aggressor signature in the outright books, which fits the fact that most of the roll is executed passively in the spread book itself.
We also have to report that this measurement is fragile. Removing a single day from the flow window flips the ES result from −1.76 to +1.31, and 18 of 49 rolls change their flow sign. That is noise-dominated, and the honest conclusion is "this design could not detect an effect", not "there is cleanly no effect". The smallest effect the design could have found at 80 percent power was 2.68 ticks — larger than the 2.43-tick round-turn cost of executing the spread through the two outright legs. Even a detectable result would have been marginal after costs.
Result 4: the out-of-sample test, and it failed
Everything up to here shares a weakness we had written down in advance: the direction "impact rises at the roll" was originally noticed in the same ES data it was then tested on. Preregistration protects against tuning a result after the fact. It does not protect against a hypothesis that was born in-sample.
Crude oil was the fix. WTI rolls monthly, is a different asset class, and follows a different specification — the last trading day is three business days before the 25th of the month preceding delivery. That yields 88 rolls of genuinely unused data. It was declared, in advance, as the single confirmatory test.
It failed.
| Λ | Standard error | p (one-sided, as predicted) | Rolls | |
|---|---|---|---|---|
| CL (WTI crude) | −0.0500 | 0.0151 | 0.66 | 88 |
The sign is wrong, and the result is not significant. But the more careful statement is stronger than "the sign is wrong": the null distribution for crude — the same statistic computed at random dates in the same data — is itself centred at −0.040. The observed value sits 0.4 standard deviations below that. Λ in crude is indistinguishable from noise, not negative.
Two preregistered controls also failed on crude, and both belong in the record:
- The second, equally valid anchor (the volume crossover) was supposed to give the same sign. It gives +0.043 ± 0.014 against −0.050 at the last trading day. The sign depends on which anchor you pick.
- The placebo was supposed to come out at or below zero. It comes out at +0.128 — more than twice the magnitude of the real measurement, with the opposite sign. We had named a specific contamination in advance as the likely cause; removing it directly changes the number by about 3 percent. It does not explain the placebo.
NQ, YM and RTY do replicate ES cleanly. But they roll on the same date as ES, on the same calendar days, so they are four order books rather than four independent draws — which is why they were declared secondary before any of this was computed, and why they cannot rescue the confirmatory test.
Why crude behaves differently
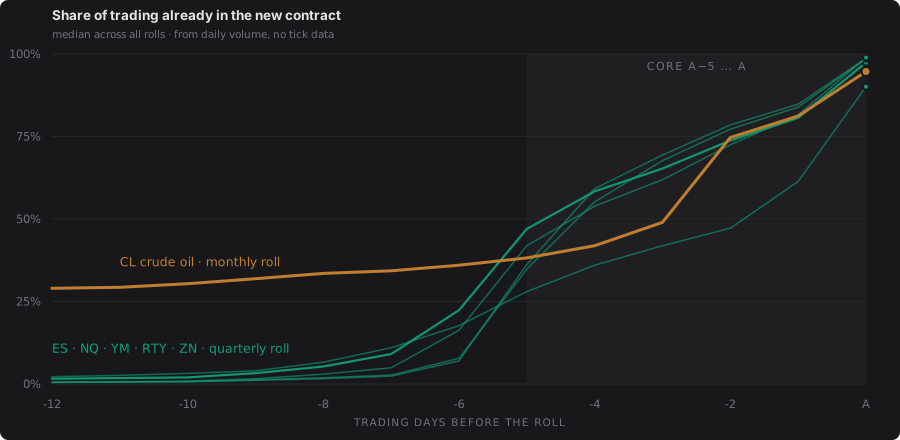
Median share of two-leg volume already in the new contract, per trading day before the roll. Computed from daily volume — no tick data involved.
The chart is the whole explanation. Twelve days out, the new contract in the five quarterly markets carries 0.5 to 2.2 percent of the combined volume — it effectively does not exist yet. Then it jumps to 28–47 percent within a week.
In crude, the next contract already carries 29 percent twelve days out, and has only reached 38 percent by A−5. There is no jump, because there is no moment at which one deep book becomes two shallow ones. Both windows we compare already contain two live books, so the contrast the statistic is built to detect is simply not there.
The order book decomposition says the same thing from the other side:
| New book vs. old, before the roll | Old book's impact, into the core | |
|---|---|---|
| ZN | 13.4× thinner | +29 % |
| ES | 5.6× thinner | +77 % |
| NQ | 4.2× thinner | +41 % |
| YM | 3.9× thinner | +56 % |
| RTY | 3.0× thinner | +48 % |
| CL | 1.6× thinner | +9 % |
In crude the new book starts out nearly as deep as the old one, the old one barely deteriorates — and inside the core the new book is actually the better of the two while carrying 62 percent of the trading. That is why the volume-weighted average falls.
The most robust piece of this whole comparison needs no tick data at all. Open interest migration concentrates in the three busiest days at 63 to 70 percent in the quarterly markets, against 37.7 percent in crude. And where the combined two-leg volume in the core runs above the flank in the index markets, in crude it runs below it. Crude simply rolls differently — slowly, continuously, and without a liquidity cliff.
What a trader can take from this
- In index futures, the roll week is measurably more expensive per contract. The effect is concentrated in the five days up to expiry, it is large, and it is stable across twelve years and four markets. If you size positions or model slippage, that window is not like the rest of the month.
- Do not read a trading edge into it. Most or all of the increase is the mechanical consequence of split liquidity, and we could not isolate anything beyond it. Nothing here says the market is mispriced.
- There is no directional signal we could find in the calendar spread, and the flow that everyone knows is coming does not leave a usable footprint.
- Do not generalise across asset classes. The same measurement on crude produces nothing, and the reason is the shape of its roll, not the quality of the data. Any roll-related rule of thumb should be re-checked on the specific contract you trade.
How this was kept honest
Negative results are easy to produce by accident, so the guardrails matter more than usual:
- Preregistration before computation. The statistic, window, direction, nulls, controls and abort conditions were frozen in writing before any number was computed. A dated change log records every deviation, including the ones that made our own case weaker.
- Failures reported as failures. Both broken controls on crude are in this note. So is the fact that one preregistered expectation — that the number of usable crude rolls would be 87, not 88 — did not come true, and that the model we used in the second chapter predicts the opposite sign for crude.
- Nulls that cannot flatter. Every result is compared against random anchors drawn from the same instrument's own calendar, with a blocking rule so the null cannot contain the real events. Where the blocked pool came out too small to be meaningful — which happens structurally for a monthly roll — we report no p-value rather than a convenient one.
- Tests that are tested. Every statistic has unit tests against hand-computed target values, and every test is checked by deliberately breaking the code to confirm the test notices. Six tests in this project passed while proving nothing; each was caught only by that mutation step, and each is now a real test. The suite stands at 532 checks.
- Independent review. Each chapter went through review passes that recompute the published numbers from the artifacts and attack the reasoning. The two failed controls above were promoted from footnotes to findings by exactly that process.
Frequently asked questions
Does liquidity get worse during the futures contract roll? In equity index futures, yes, and measurably so. In the five trading days up to the roll, the average contract traded moves the price about 17 to 26 percent more than in the preceding week — measured on ES, NQ, YM, RTY and ZN over 48 to 27 rolls each. Most or all of that increase is the arithmetic of one deep order book splitting into two shallower ones, which we could not separate from a genuine deterioration.
When exactly does the roll happen in ES futures? The volume crossover in ES sits three to five trading days before the third-Friday expiry, most often at four or five days. Open interest migrates in a burst: the three busiest days carry about 63 percent of the whole migration. The expiry date itself is fixed years in advance by the contract specification, so the timing is known, not estimated.
Is there a tradable edge in the calendar spread during the roll? We found none. Testing whether the direction of the forced roll flow moves the calendar spread gave a result with the wrong sign and no significance (ES: −1.76 ticks, p = 0.95), and the sign of the roll flow itself was close to a coin flip. The measurement was also fragile: shifting the flow window by a single day flipped the result. The honest reading is that this design could not detect an effect, not that a zero was cleanly measured.
Does the roll effect hold for crude oil futures? No. On 88 WTI crude rolls the same statistic came out at −0.050, the opposite of the predicted direction, and statistically indistinguishable from random anchors in the same data (p = 0.66). The reason appears to be structural: WTI rolls monthly and gradually, so the next contract already carries about 29 percent of trading twelve days out, and there is no moment when one deep book becomes two shallow ones.
What is Kyle's lambda and why measure the roll with it? Kyle's lambda is the slope of price change against signed order flow — in plain terms, how far the price moves per contract traded. It is a direct measure of how much size a market can absorb, which is exactly the quantity that should change when trading splits across two contracts. We measure it on the mid-price in 30-minute buckets, on both contract legs at once, and weight the two legs by volume.
Data: Sierra Chart tick and daily files for ES, NQ, YM, RTY, ZN and CL, 2014–2026, read-only. Impact is measured on the mid-price, so it reflects the price response to order flow rather than an execution cost. Nothing in this note is trading advice, and none of it is a claim about future price direction.