Initial Balance Trading: How to Use the IB Range for Day Trading Futures
The Initial Balance defines the first hour's trading range and sets the tone for the entire session. Learn how to use IB High, IB Low, and IB width in your trading.
The Initial Balance (IB) is one of the oldest and most reliable concepts in market profile theory. Developed by Peter Steidlmayer, the IB represents the price range established during the first hour of Regular Trading Hours — and it sets the framework for the rest of the session.
Professional futures traders use the IB every single day. Here's how it works and why it matters.
What Is the Initial Balance?
Initial Balance (IB) = The high and low of the first hour of RTH (Regular Trading Hours).
For US futures (ES, NQ, CL), RTH starts at 9:30 AM ET. The Initial Balance is set from 9:30 to 10:30 AM ET.
IB High: The highest price traded during the first hour IB Low: The lowest price traded during the first hour IB Range (Width): IB High minus IB Low
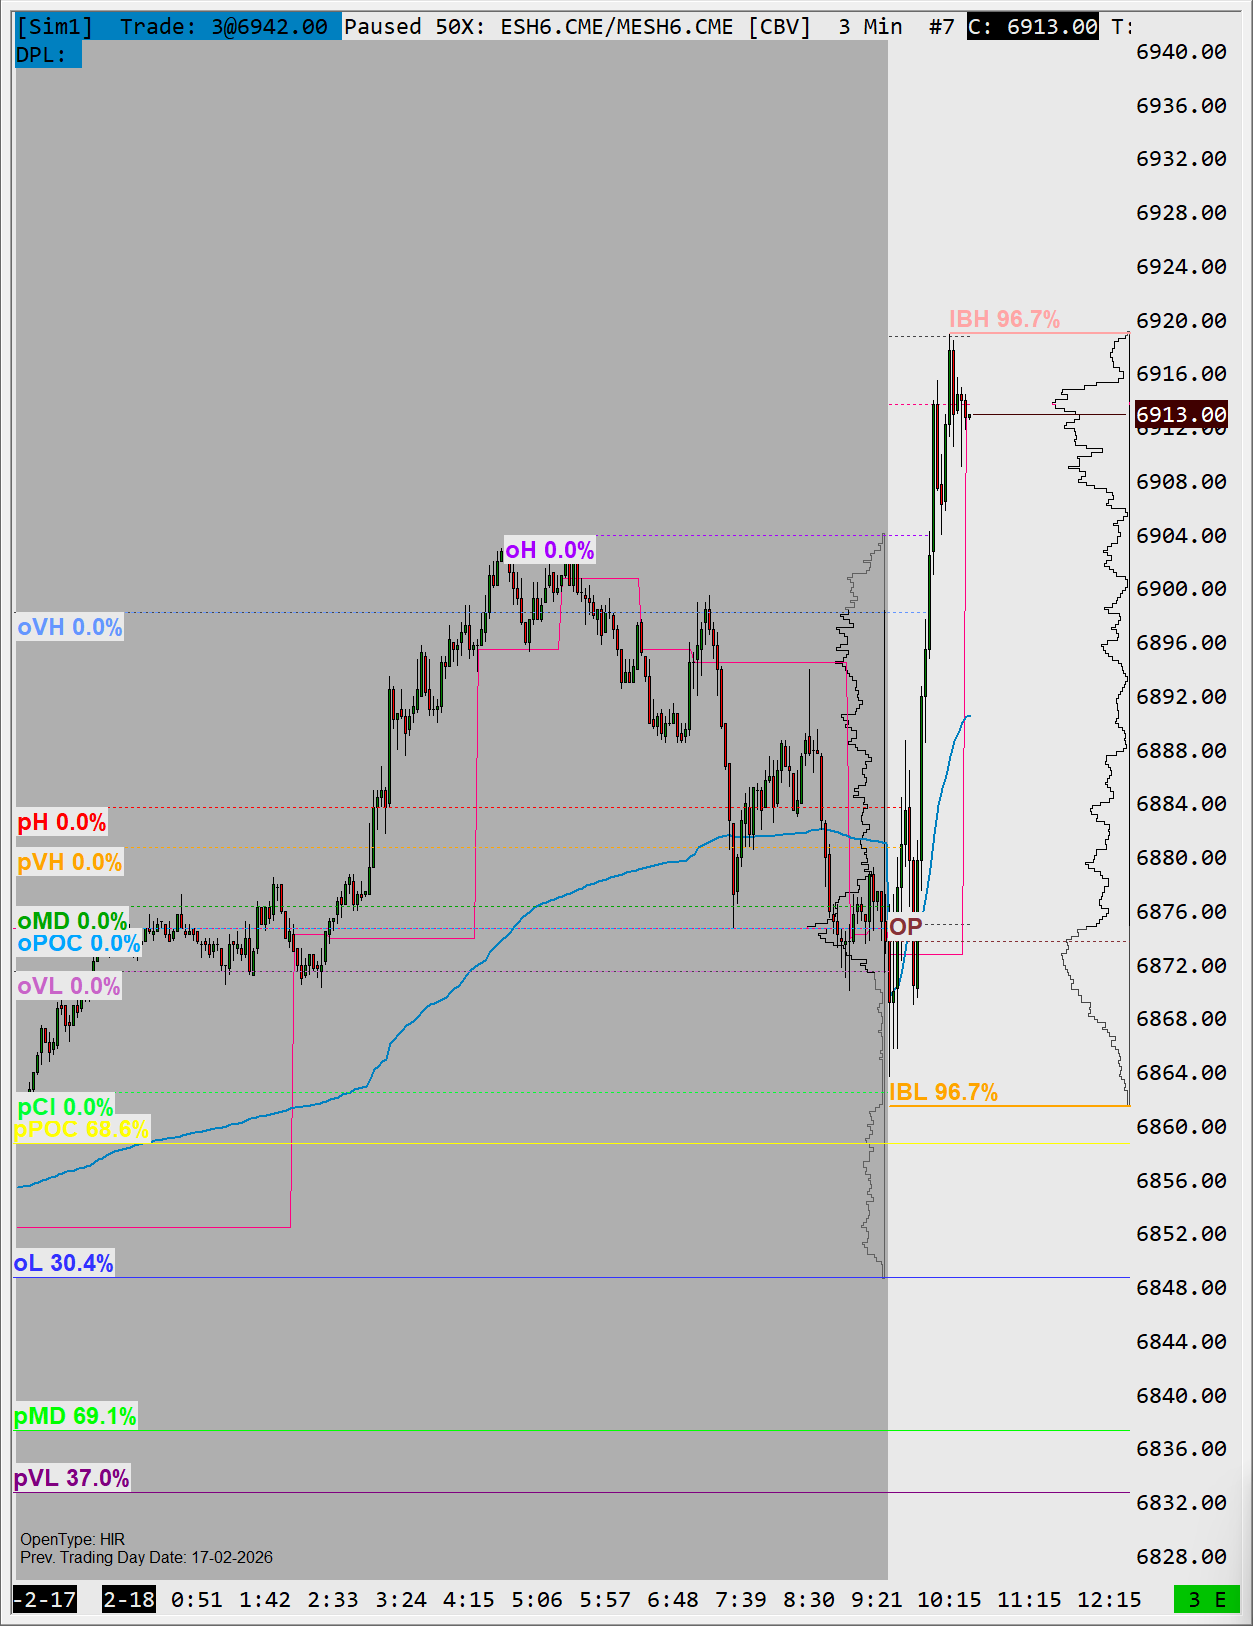
ES Futures (3 Min) — IBH at 6920 and IBL at 6862, both tested with 96.7% historical rate. HIR open type session, February 18, 2026. Statistics displayed by StatLevels Suite.
Why the Initial Balance Matters
It Predicts the Day Type
Research by market profile practitioners has shown a strong correlation between IB width and the type of day that follows:
Wide IB (large first-hour range):
- Suggests institutions were active in the first hour
- Higher probability of a range-bound day within the IB
- Price often stays within or near the IB for the rest of the session
- Breakouts from a wide IB require significant conviction
Narrow IB (small first-hour range):
- Suggests uncertainty or positioning before a move
- Higher probability of a breakout/trend day
- When price breaks the IB, the move can be substantial
- Both IB High and IB Low are vulnerable to being broken
It Creates Actionable Levels
IB High and IB Low become two of the most important levels for the rest of the session:
- Support and resistance: Price often reacts at IB boundaries
- Breakout triggers: A break beyond IB with volume signals directional commitment
- Measured moves: The IB width provides a target framework (1x, 1.5x, 2x IB extension)
How to Trade with the Initial Balance
Strategy 1: IB Fade (Range Day Expectation)
When to use: Wide IB, market opened inside the prior day's range (HIR/LIR/NOR open types)
Setup:
- Wait for price to reach IB High or IB Low after 10:30 AM
- Look for rejection signals at the IB boundary
- Enter short at IB High (or long at IB Low) targeting the opposite boundary
- Stop: just beyond the IB boundary
Logic: A wide first-hour range suggests that the major participants have already positioned. The rest of the day often rotates within this established range.
Strategy 2: IB Breakout (Trend Day Expectation)
When to use: Narrow IB, especially with a HOR or LOR open type
Setup:
- Price breaks decisively above IB High (or below IB Low)
- Volume confirms the breakout (above average)
- Enter on a pullback to the broken IB level (now support/resistance)
- Stop: back inside the IB
Targets:
- 1x IB extension: IB High + IB Range (or IB Low - IB Range)
- 1.5x IB extension: for strong trend days
- 2x IB extension: for exceptional trend days
Logic: A narrow first-hour range means the market hasn't decided yet. When it does decide (by breaking the IB), the move tends to be directional and sustained.
Strategy 3: Failed IB Breakout (Trap Trade)
When to use: Price breaks IB High/Low briefly, then reverses back inside
Setup:
- Price pushes beyond IB boundary by a few ticks
- Fails to hold and re-enters the IB range
- Enter in the direction of the failure (short on failed IB High breakout, long on failed IB Low breakdown)
- Target: opposite IB boundary or VPOC
- Stop: beyond the failed breakout extreme
Logic: Failed breakouts trap breakout traders on the wrong side. Their stop-outs fuel the reversal.
IB Width as a Volatility Indicator
The IB width itself is an important piece of information. Track it relative to the average IB width for your contract:
| IB Width vs Average | Interpretation | Likely Day Type |
|---|---|---|
| < 50% of average | Very narrow | High breakout probability |
| 50-80% of average | Below average | Moderate breakout probability |
| 80-120% of average | Normal | Could go either way |
| 120-150% of average | Wide | Likely range-bound |
| > 150% of average | Very wide | High probability of staying in IB |
For ES futures, a "normal" IB range is roughly 10-20 points in recent market conditions (this varies with volatility regimes). An IB of 5 points is narrow and suggests a breakout is coming. An IB of 30+ points is wide and suggests the day's range may already be established.
IB Statistics: What the Data Shows
Real ES data (~1,337 sessions) reveals how reliably each IB boundary is tested — and the numbers are striking:
| Open Type | Sessions | IBH Tested | IBL Tested | Both Tested | Either Tested |
|---|---|---|---|---|---|
| HOR | 305 | 60.7% | 62.0% | 23.9% | 98.7% |
| HIR | 427 | 67.0% | 59.5% | 29.7% | 96.7% |
| LIR | 386 | 68.7% | 61.7% | 32.6% | 97.7% |
| LOR | 206 | 66.5% | 61.7% | 30.1% | 98.1% |
| NOR | 13 | 84.6% | 61.5% | 46.2% | 100% |
The standout finding: at least one IB boundary (IBH or IBL) is tested in 96.7–100% of all sessions, regardless of open type. This is among the most reliable statistics in market profile analysis — the IB is almost always touched.
What varies significantly is which boundary gets tested and how often both are tested. On trend days (HOR/LOR), one boundary gets extended while the other might not — which is why the "both tested" rate is lower (~24–30%) on gap opens compared to balanced opens.
IB and Other Market Profile Levels
The Initial Balance doesn't exist in isolation. Its relationship to other levels creates higher-probability setups:
IB High Near Prior Day VAH
When IB High forms near yesterday's VAH, this creates a double resistance zone. A rejection here is more meaningful than either level alone. Conversely, a breakout through both levels signals strong directional commitment.
IB Low Near Prior Day VAL
Mirror image — double support zone. Holds carry more weight, and breaks signal conviction.
IB Range Contains VPOC
When the prior VPOC sits inside today's IB range, the session is likely to be rotational. The VPOC acts as an internal anchor that keeps price oscillating within the IB.
IB Completely Above Prior Day High / Below Prior Day Low
This is consistent with a gap open: HOR if the IB formed entirely above yesterday's high (pH), LOR if entirely below yesterday's low (pL). The market opened outside the prior day's range and the first hour confirmed that territory. Old value area levels become less relevant for directional bias in this context.
Understanding these relationships across multiple levels simultaneously is where automated tools like StatLevels Suite add value — tracking 15 levels with context-aware probabilities would be overwhelming to do manually.
IB Extension Targets
When price breaks out of the IB, the IB width itself provides natural target levels:
Calculation:
- IB Range = IB High - IB Low
- Upside targets: IB High + (IB Range × multiplier)
- Downside targets: IB Low - (IB Range × multiplier)
Common multipliers:
| Extension | Calculation | Frequency |
|---|---|---|
| 1.0x IB | IB boundary + 1× IB range | Reached on most breakout days |
| 1.5x IB | IB boundary + 1.5× IB range | Reached on strong trend days |
| 2.0x IB | IB boundary + 2× IB range | Reached on exceptional trend days |
| 3.0x IB | IB boundary + 3× IB range | Rare — extreme trend days only |
Example: IB High = 5,510, IB Low = 5,500 (IB Range = 10 points)
- 1.0x upside target: 5,520
- 1.5x upside target: 5,525
- 2.0x upside target: 5,530
These extensions work well as take-profit targets, especially when combined with proper position sizing that distributes contracts across multiple targets.
Key Takeaways
- IB is the first hour's range (9:30-10:30 AM ET for US futures)
- Narrow IB → expect breakouts, wide IB → expect range
- IB High and IB Low are actionable levels for the entire session
- IB width extensions provide natural take-profit targets (1x, 1.5x, 2x)
- Failed IB breakouts are some of the best reversal trades available
- Combine IB with open type to determine the probability of each scenario
- Track IB width relative to average to calibrate your expectations for the day
Frequently Asked Questions
What is the initial balance in trading?
The Initial Balance (IB) is the high and low of the first hour of the regular trading session. For US futures like ES, NQ and CL it is set between 9:30 and 10:30 AM ET. The IB High, IB Low and the range between them act as reference levels for the rest of the day and help predict whether a range or trend day is likely.
What time is the initial balance set?
For US index and energy futures the initial balance covers the first 60 minutes of Regular Trading Hours — 9:30 to 10:30 AM ET. Some traders also watch a 30-minute IB, but the standard one-hour IB is the most widely used.
Should you fade the IB midpoint (IB 1/2)?
The IB midpoint — the 50% level between IB High and IB Low — tends to act as a magnet on balance days, so fading moves back toward it can work when the day is rotational. On trend days price accepts away from the midpoint and fading it is a losing trade, so the decision depends on the open type and IB width: fade the midpoint on wide-IB / inside-range opens, and respect breakouts on narrow-IB / out-of-range opens.
How wide should the initial balance be?
There is no fixed number — what matters is the IB width relative to its recent average. A narrow IB (below average first-hour range) raises the odds of an IB breakout and trend day, while a wide IB raises the odds of a range-bound day that stays near the IB. Comparing today's IB width to the average is more useful than any absolute value.
Ready to upgrade your trading?
Discover our professional tools for Sierra Chart.