·Research·Options·ES Futures·Market Microstructure
Does Option Gamma Hedging Move ES Futures? What 740 Trading Days Show
Dealer gamma is one of the most quoted ideas in index trading: long gamma calms the market, short gamma lets it run. We tested it on ES with a preregistered design and three years of option data. The regime does separate quiet days from wide ones — but most of that is VIX and recent trend, and gamma strikes are not levels.

"Dealers are long gamma, expect a tight day." "We are below the gamma flip, anything can happen." Few ideas have spread through index futures trading as fast as dealer gamma. The mechanism is easy to explain, the numbers are published every morning, and the story fits almost any chart after the fact.
That made it worth testing properly. We asked one practical question: does the net gamma position in S&P 500 options tell an ES trader, before the open, what kind of day to expect? Rotational and tight, or directional and wide — and are the big gamma strikes levels that the market respects?
This note reports what we found, including the parts that came back negative. The short version: the regime does separate quiet days from wide ones, and the difference is large. But most of it is information a trader already has from the VIX and the recent trend, and none of the level-based claims held up.
The mechanism being tested
Options market makers take the other side of customer trades and hedge their delta in the underlying — ES futures, SPY, or the stock basket.
- If dealers are net long gamma, their hedging works against the move: they sell into rallies and buy into dips. Moves should fade, ranges should be tighter, and price should gravitate toward strikes with heavy open interest.
- If dealers are net short gamma, their hedging works with the move: they sell into weakness and buy into strength. Moves should extend, ranges widen, trend days become more likely.
The catch is that dealer positions are not public. Open interest tells you how many contracts are outstanding, not who holds which side. Every published gamma number rests on an assumption about that. We therefore computed the signal under three different positioning assumptions in parallel, and only counted a result as supported if it pointed the same way under at least two of them.
How the study was built
- Data: end-of-day open interest and quotes for every SPX option series, January 2022 to December 2024, plus a separate pilot year from September 2025 to September 2026. ES regular-session data from tick files.
- Signal: for each series, gamma × open interest × contract multiplier, scaled to a 1 percent move. Under the standard assumption, dealers are long calls and short puts, so net gamma is call gamma minus put gamma. Each day was ranked against the previous 252 sessions and placed in a tercile — top, middle or bottom.
- Only information available before the open: open interest as of the prior close, option prices from the prior day. Option sensitivities were computed independently from the quotes.
- Preregistration: the hypotheses, tercile cut-offs, sample split, controls and decision rules were written down and frozen before the main dataset was obtained, based only on the pilot year.
- Out-of-sample split: January 2022 to June 2023 for development, July 2023 to December 2024 for validation. The validation window was evaluated only after the development results were saved.
- Controls: every test includes the prior-day VIX, the prior day's and prior week's value of the measured quantity, and flags for contract rolls, quarterly expirations, FOMC days, month end and weekday. Placebo tests shift the signal in time by blocks of a month or more, 1,000 times.
In total, 740 ES sessions entered the main study.
Result 1: put-heavy days are much wider than call-heavy days
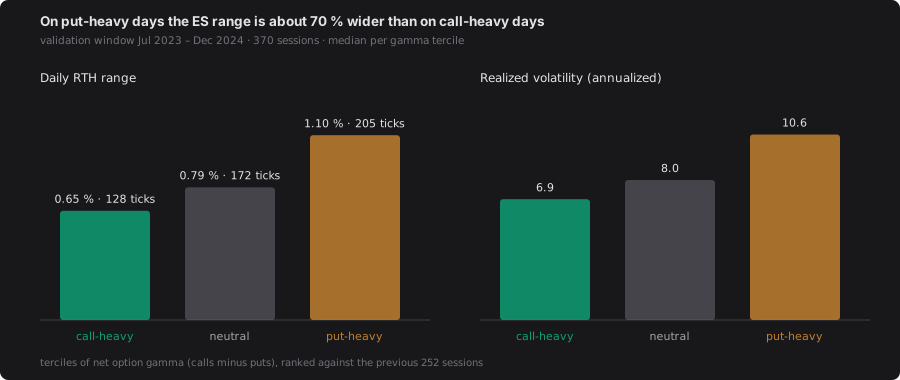
Median per tercile, validation window July 2023 – December 2024. "Call-heavy" is the classic long-gamma reading, "put-heavy" the short-gamma reading.
The headline holds. In the validation window:
| Top tercile (long gamma) | Middle | Bottom tercile (short gamma) | |
|---|---|---|---|
| Median daily range | 0.65 % | 0.79 % | 1.10 % |
| In ES ticks | ≈ 128 | ≈ 172 | ≈ 205 |
| Median realized volatility | 6.9 | 8.0 | 10.6 |
| Days with a below-median range | 75 % | 52 % | 24 % |
Both the range and the realized volatility effect passed every preregistered criterion: significant after correcting for multiple tests (t-statistics of −4.7 and −5.0), the same direction under all three positioning assumptions, the same direction in the development window, and far outside the placebo distribution. The pilot year, measured independently a year later, showed the same direction and a similar raw size.
By the rules we set in advance, the two claims are supported. Taken at face value, that is a useful morning filter: on a put-heavy day, expect the range to be roughly 70 percent wider.
Result 2: most of it is VIX and recent trend
The face value is where most gamma commentary stops. It is also where the important part begins.
The gamma signal is not independent of things a trader already sees. In the validation window it correlated −0.63 with the VIX, and +0.74 with the ES return over the previous five days (+0.72 over twenty days). After rallies, open interest is call-heavy and the signal reads "long gamma". After sell-offs, it is put-heavy and reads "short gamma". And after sell-offs, ranges are wide anyway.
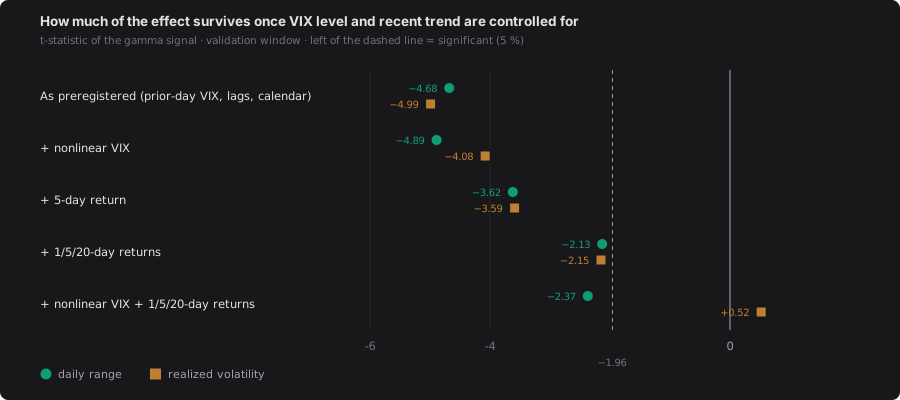
The same test, with more of what a trader already knows added as controls. Computed after the preregistered results were saved, so it does not change their status — but it changes how they should be read.
Adding recent returns as controls cuts the effect roughly in half. Adding a nonlinear VIX term on top leaves a small, still significant effect on the range (about 0.18 percentage points, or ~37 ticks, between a typical high and low reading) and nothing on realized volatility.
A cross-tabulation makes the same point. Inside each VIX tercile there is still a gradient from call-heavy to put-heavy days — but the combinations that would show gamma working on its own barely exist:
| Median range (sessions) | Long gamma | Middle | Short gamma |
|---|---|---|---|
| Low VIX | 0.60 % (75) | 0.65 % (47) | 0.75 % (3) |
| Middle VIX | 0.71 % (42) | 0.89 % (44) | 0.82 % (35) |
| High VIX | 0.70 % (4) | 0.94 % (35) | 1.12 % (85) |
Long gamma with a high VIX happened on 4 days out of 370; short gamma with a low VIX on 3. In practice, the gamma regime is mostly the VIX said in a different way.
The effect is also uneven across time. Beyond what the VIX explains, it was clearly present in 2022 and 2024 and practically absent in 2023, a calm, steadily rising market:
| Year | Range effect beyond VIX (t) | Sessions |
|---|---|---|
| 2022 | −2.74 | 226 |
| 2023 | −1.12 | 245 |
| 2024 | −6.24 | 246 |
Result 3: the raw effect is too large to be hedging
If dealer hedging drove the result, its size should be in line with what direct measurements of that hedging show. Two recent studies make the comparison possible, because they work with actual market-maker positions rather than estimates from open interest.
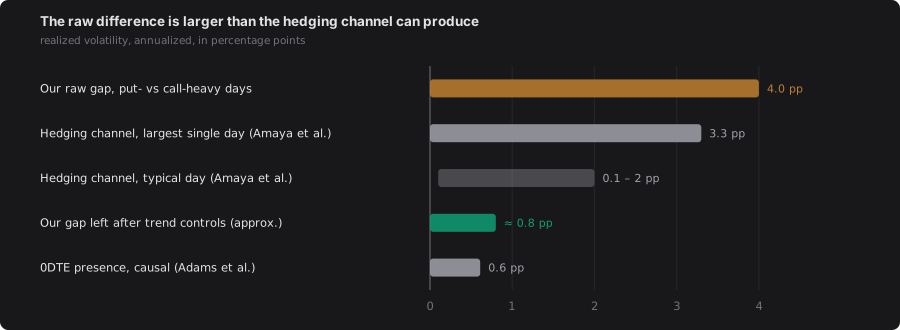
Annualized realized volatility, percentage points. Literature values from Amaya, Garcia-Ares, Pearson and Vasquez (2025) and Adams et al. (2026).
Using Cboe trade records that identify market makers, Amaya and co-authors estimate that gamma hedging changes daily realized volatility by typically 0.1 to 2 points, with a maximum of 3.3 points on any single day. Adams and co-authors put the causal effect of 0DTE options on daily volatility at about 0.6 points. Our raw difference between put-heavy and call-heavy days is 4.0 points — above the largest single-day effect the hedging channel produces. It cannot be mostly hedging. What is left after trend controls, around 0.8 points, is about the size the literature attributes to the real mechanism.
Two further findings from that literature change how the whole concept should be described:
- Dealers are almost always long gamma. With actual Cboe positions, dealer net gamma is positive in about 88 percent of intraday intervals. Customers tend to sell at-the-money options and buy far out-of-the-money ones, and the at-the-money exposure dominates. An open-interest estimate that assumes "dealers long calls, short puts" mainly measures how call-heavy or put-heavy the open interest is. In our data, that swing is about ±10–15 percent of total gamma — a tilt, not a flip of the dealer book.
- Market makers rarely hedge with futures the way the story assumes. Account-level data from the Korean index options market show that only 4 of 43 market makers hedged consistently, and futures accounted for about half a percent of how they worked off their risk. For S&P 500 options, the actual change in market makers' net delta is about 32 times smaller than a naive hedge of their trading volume would imply. Most risk is managed by adjusting option inventory, not by trading the underlying at specific prices.
Result 4 (negative): no pinning, and gamma strikes are not levels
The second half of the popular story is about prices: the market gets pinned to big strikes on expiration, and call walls, put walls and high-gamma strikes act as support and resistance. We tested all of it.
Pinning. On expiration days, ES did not close measurably closer to the largest gamma strike on long-gamma days than on short-gamma days. The estimate was not significant and partly pointed the wrong way. Not supported.
Levels. We ran three successive studies on whether price reverses more often at strikes with heavy gamma than at strikes with little gamma. Each one addressed a weakness of the one before; the last measured the touch on the actual S&P 500 cash index, not on ES or a proxy, with the gamma profile valued at the moment price arrived. For every touch, we recorded whether price first moved 20 ticks back or 20 ticks through within an hour.
| Validation window | Pilot year | |
|---|---|---|
| Strike touches evaluated | 1,715 | 1,751 |
| Smallest detectable difference in reversal rate | ≈ 15 pp | ≈ 15 pp |
| Measured difference, heavy vs. light strikes | < 1 pp | < 1 pp |
High-gamma strikes reversed no more often than any other strike. The regime of the whole book at the moment of the touch made no difference either. Not supported, in all three studies.
The one open item is the walls — the strikes with the largest call and put exposure at the open. Raw, they reversed about 28 percentage points more often than comparable strikes in the validation window. But that rests on 34 events, the preregistered model with controls sees almost none of it, the pilot year shows a much smaller difference with a confidence interval around zero, and a tighter touch definition halves the raw number. That is a sample too small to say anything, not a finding.
Given how market makers actually manage risk, the null results are what one should expect: there is no mechanical hedging flow that would turn an open-interest strike into a price level.
A hint worth watching, not a rule
One exploratory measure is consistent with the literature. On put-heavy days, an hourly move in ES tended to continue into the next hour by about 3 basis points; on call-heavy days it did not. This survived the VIX and trend controls in the validation window and matches the direction Adams and co-authors find with real dealer positions.
But it was only directionally present in the development window, and the pilot year showed the opposite sign. By our rules, that is an unstable hint. At roughly 6 ES ticks per hour, it is also smaller than typical trading costs; at most it could inform the choice between fading and following within a trade already planned.
What a trader can take from this
- The gamma regime describes the expected range, not the direction. On put-heavy days, plan for wider ranges and wider stops; on call-heavy days, for tighter ones. That much is supported.
- If you already read the VIX and the last few weeks of price action, gamma adds little. What remains on top is a small range effect and nothing on volatility. Treat the morning gamma number as a reminder of the regime, not as independent information.
- "Long gamma" and "short gamma" from open interest are labels, not observations. Measured directly, dealers are almost always long gamma. A gamma flip in an open-interest model mostly marks a shift from call-heavy to put-heavy positioning.
- Do not trade gamma strikes as levels. Across three studies and more than 3,400 touches, they performed like any other strike. The same goes for expiration pinning.
How this was kept honest
- Preregistered before the main data were obtained. Hypotheses, sample split, controls and decision rules were frozen in writing on the basis of the pilot year alone. Deviations are documented; analyses added later are labeled exploratory and did not change any status.
- Data checked against the exchange. Open interest matched official Cboe data on every series in a three-day spot check, and the option sensitivities were recomputed independently.
- Sensitivities that could have broken it. Using prior-day instead of current open interest, valuing same-day options at the open instead of the prior close, removing outliers, removing August 2024, and rank-transforming everything left the supported results intact.
- A failed extension reported as failed. We tried to extend the study back to 2018 with data that carries no open interest. A substitute signal did not track the real one closely enough, so 2018 could not be tested — and we report that rather than a result.
Frequently asked questions
Does dealer gamma predict the daily range in ES futures? In our test, yes — as a description of the day. Over July 2023 to December 2024, the median regular-session range of ES was 0.65 percent (about 128 ticks) on days in the top gamma tercile and 1.10 percent (about 205 ticks) in the bottom tercile. The difference held up against prior-day VIX, lagged ranges, calendar effects and placebo tests, and was preregistered before the main data were obtained.
Is the gamma regime more than just the VIX? Only a little. Most of the effect is a restatement of the VIX level and the market's direction over the previous 5 to 20 days: the signal correlates −0.63 with the VIX and about +0.7 with recent returns. Once both are controlled for, a small but statistically significant effect remains for the daily range, and none for realized volatility.
Do gamma strikes, call walls and put walls act as support and resistance? We found no evidence for it. Across three separate studies — the last one measured on the actual S&P 500 cash index — strikes with large gamma reversed no more often than strikes with little gamma. The design could detect differences of about 15 percentage points in the reversal rate; the measured differences were below one point. Walls showed a raw effect on a small sample that did not survive the preregistered model.
Does the market pin to the largest gamma strike on expiration days? Not in our data. On expiration days in 2022 to 2024, ES did not close measurably closer to the strike with the most gamma on long-gamma days than on short-gamma days, and the sign of the estimate was partly in the wrong direction.
Are options dealers actually short gamma on volatile days? Probably not. Research using actual Cboe market-maker positions finds dealers net long gamma in about 88 percent of intraday intervals. A gamma estimate built from open interest mainly measures how call-heavy or put-heavy the outstanding options are — which shifts after rallies and sell-offs — rather than a true flip in the dealer book.
References
- Adams, Dim, Eraker, Fontaine, Ornthanalai and Vilkov (2026). Do S&P 500 Options Increase Market Volatility? Evidence from 0DTEs. Working paper.
- Amaya, Garcia-Ares, Pearson and Vasquez (2025). 0DTE Index Options and Market Volatility: How Large is Their Impact? Working paper.
- Hu, Kirilova, Muravyev and Ryu (2025). Options Market Makers. Working paper.
- Baltussen, Da, Lammers and Martens (2021). Hedging Demand and Market Intraday Momentum. Journal of Financial Economics.
- Ni, Pearson, Poteshman and White (2021). Does Option Trading Have a Pervasive Impact on Underlying Stock Prices? Review of Financial Studies.
Data: end-of-day SPX option data 2022–2024 and September 2025 – September 2026, Sierra Chart tick data for ES, and the S&P 500 cash index from June 2023. Realized volatility is computed from 5-minute returns in the regular session and annualized. Nothing in this note is trading advice, and none of it is a claim about future price direction.