VAH and VAL: What Value Area High and Low Mean in Trading
VAH (Value Area High) and VAL (Value Area Low) mark the edges of the price range where 70% of volume traded. Learn what VAH and VAL mean and how to trade them as support and resistance.
The Value Area is one of the most powerful concepts in market profile analysis. Defined as the price range where approximately 70% of a session's volume traded, it provides a statistical framework for understanding where the market considers "fair" and where it considers "extreme."
The boundaries of this range — VAH (Value Area High) and VAL (Value Area Low) — become actionable trading levels that professional traders reference every single session.
What Are VAH and VAL?
VAH (Value Area High): The upper boundary of the value area. The highest price within the zone where 70% of volume traded.
VAL (Value Area Low): The lower boundary of the value area. The lowest price within the zone where 70% of volume traded.
VPOC: The price with the most volume — sits between VAH and VAL.
Together, these three levels define the market's "bell curve" for a given session:
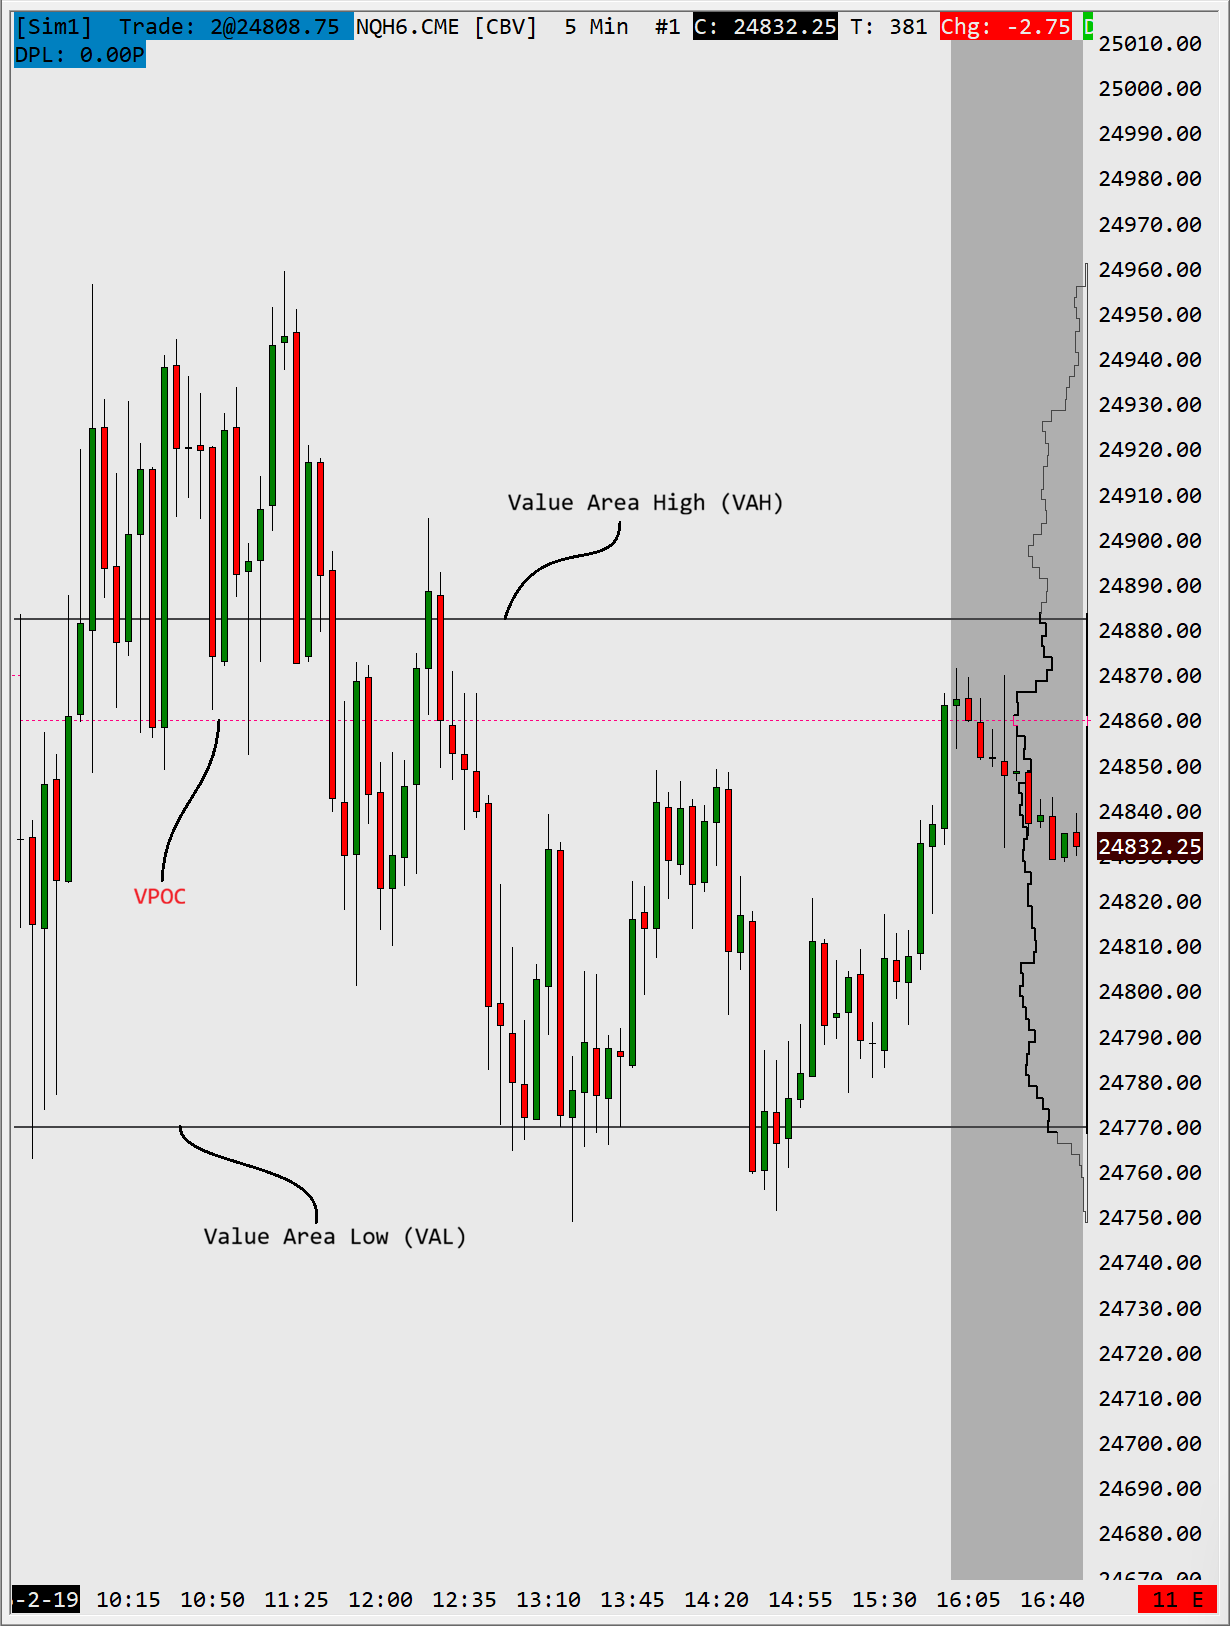
NQ Futures (5 Min) — VAH at 24,880, VPOC at 24,860, VAL at 24,770 — February 19, 2026
The area between VAH and VAL is where the market spent most of its time and traded most of its volume. Prices above VAH and below VAL are the "extremes" — areas visited briefly before being rejected back toward fair value.
Why VAH and VAL Matter
The 70% Rule
By definition, 70% of all trading activity occurred between VAH and VAL. This means:
- 30% occurred outside the value area — at the extremes
- Price at these extremes was considered "unfair" by the majority of participants
- When price returns to these extreme levels, it often encounters a reaction
Acceptance vs. Rejection
When the current session's price interacts with the prior session's VAH or VAL, one of two things happens:
Rejection: Price tests VAH/VAL and reverses. This means the market still considers these prices unfair — the prior session's value area remains valid.
Acceptance: Price moves through VAH/VAL and stays. Volume begins building beyond the prior value area. This signals that fair value is shifting — the market has found a new equilibrium.
Distinguishing between rejection and acceptance is one of the most important skills in market profile trading.
Trading Strategies with VAH and VAL
Strategy 1: Value Area Fade
Concept: When price moves to the edge of the prior value area, fade it back toward VPOC.
Long setup at VAL:
- Price pulls back to prior day VAL
- Market opened inside the prior value area
- Look for rejection signals (bid absorption, failed breakdown)
- Enter long, targeting VPOC or VAH
- Stop below VAL by a few ticks
Short setup at VAH:
- Price rallies to prior day VAH
- Market opened inside the prior value area
- Look for rejection signals (offer absorption, failed breakout)
- Enter short, targeting VPOC or VAL
- Stop above VAH by a few ticks
When this works best: Balance days where the market opened inside the prior day's range (between the prior high and low). Open types HIR (open inside range, above prior close) or LIR (open inside range, below prior close) both produce rotational days where VAH/VAL fades have a statistical edge.
Strategy 2: Value Area Breakout
Concept: When price breaks and accepts beyond VAH/VAL, trade the continuation.
Long breakout above VAH:
- Price breaks above prior VAH and holds
- Volume builds above VAH (acceptance)
- Pullback to VAH (now support) → enter long
- Target: next resistance level or measured move
Short breakdown below VAL:
- Price breaks below prior VAL and holds
- Volume builds below VAL (acceptance)
- Pullback to VAL (now resistance) → enter short
- Target: next support level or measured move
When this works best: Trend days following a gap open. HOR (market opened above the prior day's high) and LOR (market opened below the prior day's low) are the strongest signals for directional continuation — the market has already exceeded yesterday's range before RTH even begins.
Strategy 3: Open-to-Value Trade
Concept: When the market opens outside the prior value area, trade back toward it.
- Market gaps up above VAH → short toward VPOC
- Market gaps down below VAL → long toward VPOC
Critical filter: This works on most days but fails on trend days. The open type determines the probability. An important distinction: a market can open above the value area high (VAH) but still be inside the prior day's range — that would be an HIR open, not a HOR open. HOR only applies when the market opens above the prior day's high (pH). Knowing whether the open is HIR vs HOR changes the statistical expectation significantly.
Real ES data for the prior value area levels by open type:
| Open Type | pVH Tested | pVL Tested |
|---|---|---|
| HOR | 53.8% | 22.3% |
| HIR | 72.6% | 52.0% |
| LIR | 59.6% | 67.9% |
| LOR | 18.4% | 45.1% |
| NOR | 38.5% | 38.5% |
On HIR days, the prior VAH is tested nearly 73% of the time. On LOR days, only 18% — a 4x difference from the same level. This is where probability-based statistics become essential — knowing the actual test rate under current conditions tells you whether to fade or follow.
VAH/VAL in Multi-Timeframe Context
Professional traders layer value areas from multiple timeframes:
| Timeframe | Use |
|---|---|
| Prior Day | Primary intraday reference |
| Prior Week | Swing trading context |
| Overnight Session | Pre-market positioning |
| Multi-Day Composite | Larger trend context |
Confluence zones: When the prior day VAH aligns with the weekly VAL, or when the overnight VAH sits near the prior day VPOC, these clusters become high-probability reaction zones.
VAH/VAL vs. Regular Support and Resistance
Why are VAH and VAL better than traditional support and resistance levels?
| Aspect | Traditional S&R | VAH/VAL |
|---|---|---|
| Basis | Visual highs/lows | Statistical volume distribution |
| Objectivity | Subjective (different traders draw different levels) | Objective (calculated from volume data) |
| Context | Static | Dynamic (changes with open type) |
| Probability | Unknown hit rate | Measurable historical test rates |
VAH and VAL aren't magic. They're simply more objective and statistically grounded than lines drawn on swing highs and lows. When you know the actual probability of a level being tested under current conditions, your trade selection improves.
Reading Value Area Migration
One of the most powerful applications of VAH/VAL is tracking how the value area migrates over multiple sessions:
Uptrend signal: Value area shifts higher day by day
- Today's VAL > Yesterday's VAL
- Today's VAH > Yesterday's VAH
- Indicates buyers are in control, establishing higher fair value
Downtrend signal: Value area shifts lower day by day
- Today's VAL < Yesterday's VAL
- Today's VAH < Yesterday's VAH
- Indicates sellers are in control, establishing lower fair value
Balance signal: Value area overlaps significantly
- Today's value area sits within yesterday's value area
- Indicates equilibrium — neither buyers nor sellers have conviction
This migration pattern is visible at a glance when your chart tracks value area levels automatically and shows the context-dependent statistics alongside them.
Key Takeaways
- VAH and VAL define the 70% volume zone — the market's consensus range
- Rejection = existing value holds, acceptance = value is shifting
- Fade toward VPOC on balance days, trade breakouts on trend days
- Open type determines strategy — Open Type classifies the open relative to the prior day's range (pH/pL) and close, not the value area. Same VAH/VAL levels, dramatically different probabilities depending on how the session opened
- Multi-timeframe confluence creates the highest-probability reaction zones
- Track value area migration to identify the larger trend context
- Measure the probabilities — know the actual test rates for your specific market and conditions
Frequently Asked Questions
What does VAL mean in trading?
VAL stands for Value Area Low. It is the lower boundary of the value area — the lowest price within the zone where roughly 70% of a session's volume traded. Prices below VAL are considered "unfair" by most participants and often see a reaction when revisited.
What does VAH mean in trading?
VAH stands for Value Area High, the upper boundary of the value area. It is the highest price within the zone where about 70% of a session's volume traded. Together with VAL it defines the session's "fair value" range.
What is the difference between VAH and VAL?
VAH (Value Area High) is the top of the value area and VAL (Value Area Low) is the bottom. The two levels bracket the price range where approximately 70% of volume traded, with the VPOC (highest-volume price) sitting between them. VAH typically acts as resistance and VAL as support.
What indicator shows VAH and VAL?
VAH and VAL come from a Market Profile or Volume Profile study that calculates the value area from a session's volume distribution. In Sierra Chart, our StatLevels Suite plots prior-day and prior-week VAH, VAL and VPOC automatically and adds the historical probability that each level is tested under current conditions.
Does the value area high change depending on the timeframe?
Yes. The value area is calculated per session, so VAH and VAL differ for the prior day, prior week, the overnight session, and multi-day composites. A daily VAH and a weekly VAH are different prices; professional traders layer value areas from several timeframes and treat zones where they overlap as higher-probability reaction levels.
Ready to upgrade your trading?
Discover our professional tools for Sierra Chart.