VPOC Explained: The Most Important Level in Market Profile Trading
What is VPOC and why do professional traders consider it the most important market profile level? Learn how the Volume Point of Control works and how to trade it.
If you could only look at one number on your chart before placing a trade, it should be the VPOC. The Volume Point of Control is the single most important level in market profile analysis — and one of the most statistically reliable reference points in futures trading.
Yet most retail traders either ignore it entirely or misunderstand how to use it. This guide breaks down exactly what VPOC is, why it matters, and how professional traders incorporate it into their process.
What Is VPOC?
VPOC (Volume Point of Control) is the price level where the most volume traded during a given session. It represents the price where buyers and sellers reached the most agreement — the "fair value" of that session.
Think of it this way: if volume represents consensus, then VPOC is the price the market agreed on the most. Every tick of volume at that price is a vote. VPOC is the price that won the election.
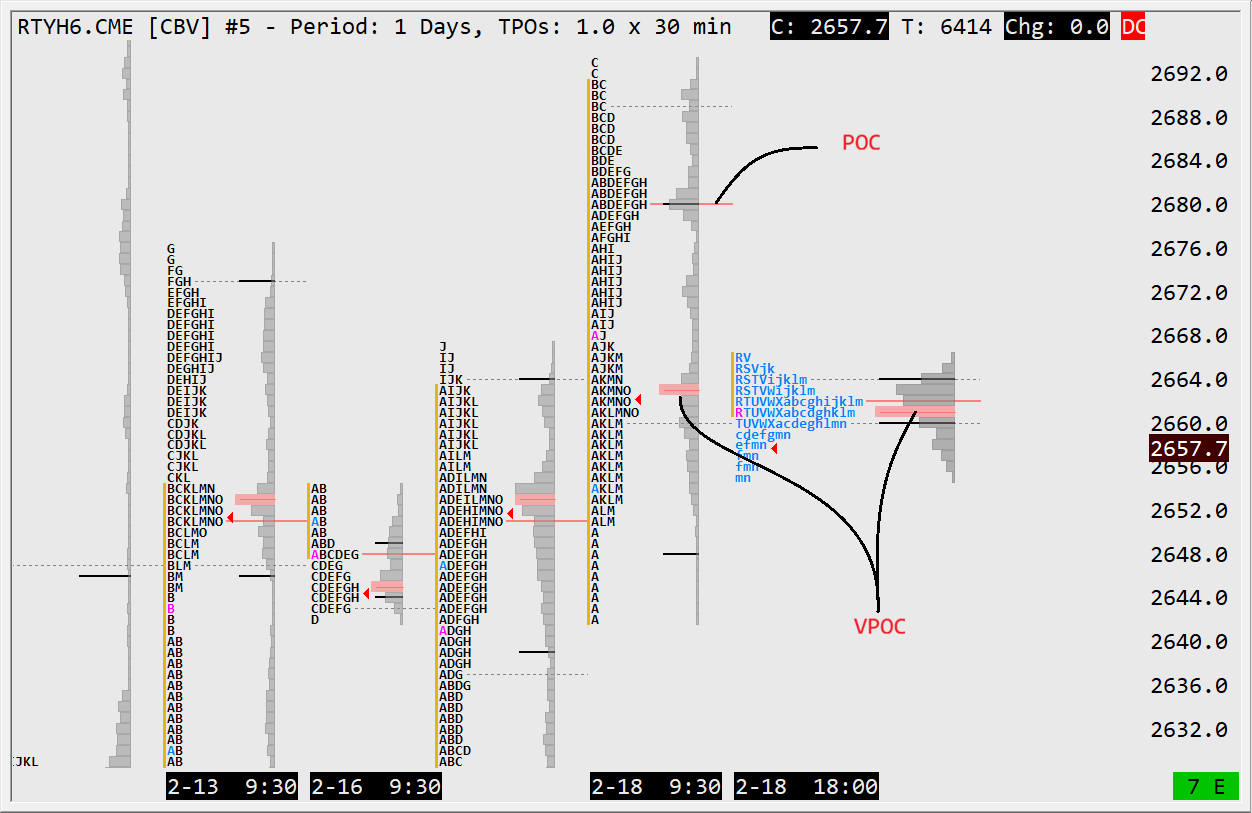
VPOC vs. POC
You'll sometimes see "POC" and "VPOC" used interchangeably, but there's a subtle difference:
- POC (Point of Control): The price with the most TPOs (Time Price Opportunities) — based on time spent at each level
- VPOC (Volume Point of Control): The price with the most actual volume traded
In practice, POC and VPOC are often at the same price or very close. But when they diverge, VPOC is generally considered more reliable because volume represents real money, not just time.
Why VPOC Matters
1. It Acts as a Magnet
Markets tend to gravitate toward VPOC. When price moves away from the prior session's VPOC, there's a statistical tendency for it to be tested at some point during the current session — especially when the market opens within the prior day's range.
This "magnet effect" exists because VPOC represents the price where the most business was conducted. Market participants who traded at VPOC have positions there. Institutional algorithms reference it. It becomes a self-reinforcing reference point.
2. It Defines Fair Value
VPOC divides the market into "above fair value" and "below fair value." This distinction helps you frame your trades:
- Price above prior VPOC: Market is trading at a premium relative to yesterday's consensus
- Price below prior VPOC: Market is trading at a discount
- Price at VPOC: Market is at equilibrium
3. It Predicts Reversion and Extension
When combined with other market profile concepts like Value Area and Open Type, VPOC becomes a powerful predictor:
- Inside day + price near VPOC: High probability of range-bound action
- Gap away from VPOC: Potential trend day if VPOC is not tested
- Price acceptance above/below VPOC: Directional conviction from institutions
How to Use VPOC in Your Trading
As Support and Resistance
Prior session VPOC acts as a dynamic support/resistance level. But unlike horizontal lines drawn at swing highs and lows, VPOC has statistical weight behind it — actual volume traded at that price.
Long scenario: Price pulls back to prior VPOC from above. If the market opened within yesterday's value area, there's a statistical tendency for VPOC to hold as support.
Short scenario: Price rallies to prior VPOC from below. If the market gapped down and hasn't reclaimed the value area, VPOC can act as resistance.
As a Target
VPOC makes an excellent take-profit target. If you enter a trade that's moving toward an untested prior VPOC, that level represents a natural destination where you might expect the move to stall or reverse.
As a Context Filter
Not all VPOCs are created equal. A VPOC from a high-volume session carries more weight than one from a low-volume session. A VPOC that has been tested and held is more significant than an untested one.
Key question to ask: "Has today's price tested yesterday's VPOC?" If not, there's a magnetic pull that may influence your trade planning.
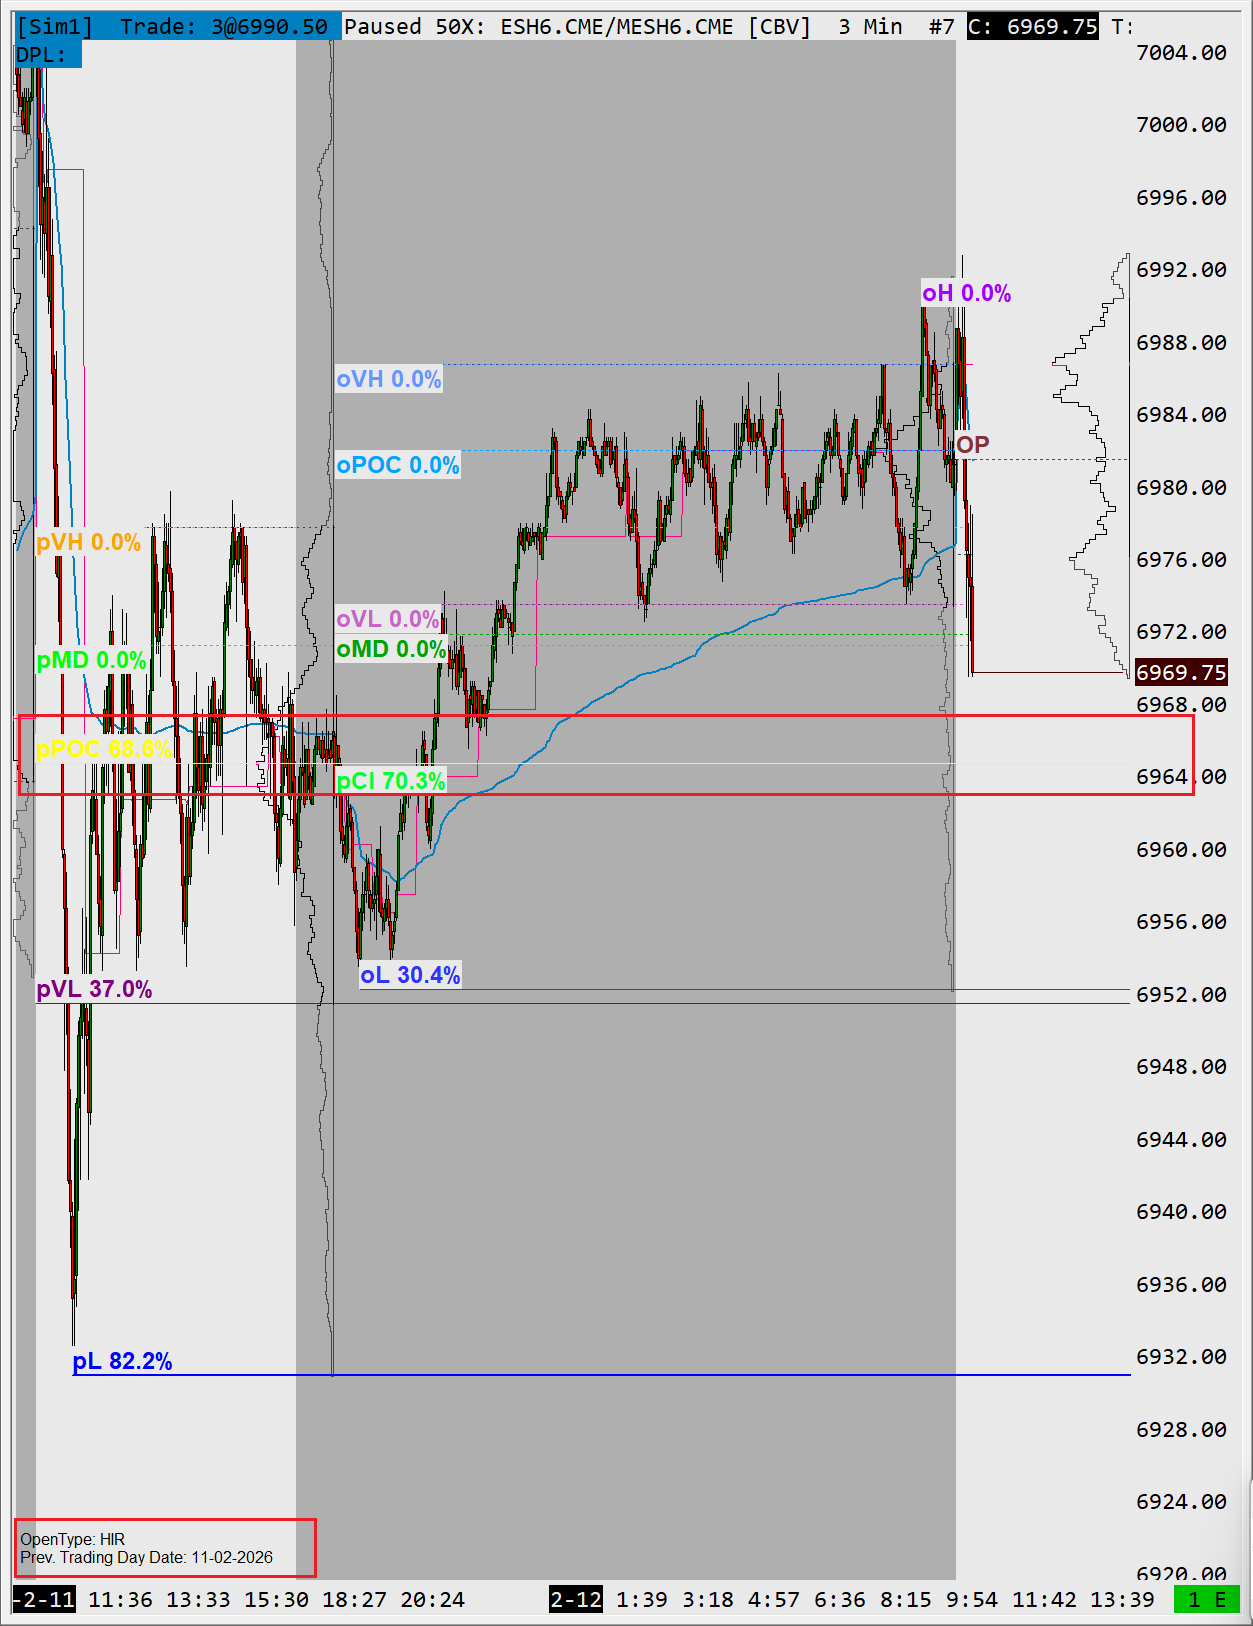
VPOC and Open Type Context
The statistical reliability of VPOC changes based on how the market opens relative to the prior day's range. This concept — called Open Type classification — dramatically affects how you should weight VPOC levels.
Open Type classifies the opening price relative to the prior day's high (pH) and low (pL), with the prior close (pCl) as the secondary divider:
- HOR: open above pH — gap above the prior day's entire range
- HIR: open inside range, above pCl — in range but in upper half
- LIR: open inside range, below pCl — in range but in lower half
- LOR: open below pL — gap below the prior day's entire range
Prior VPOC test rates by open type (ES, ~1,337 sessions):
| Open Type | Sessions | Prior VPOC Tested |
|---|---|---|
| HOR (above pH) | 305 | 41.6% |
| HIR (in range, above pCl) | 427 | 68.6% |
| LIR (in range, below pCl) | 386 | 69.2% |
| LOR (below pL) | 206 | 33.0% |
| NOR (at pCl) | 13 | 38.5% |
The pattern is clear: when the market opens inside the prior day's range (HIR or LIR), prior VPOC is tested roughly 7 out of 10 sessions. When it gaps outside the range entirely (HOR or LOR), the test rate drops to around 33–42% — and trying to fade toward VPOC against a strong gap open can be costly.
Understanding these context-dependent probabilities is what separates traders who use VPOC effectively from those who treat it as a static line. Tools like StatLevels Suite track these probabilities automatically, showing you the historical test rate for VPOC under each open type classification.
Multiple VPOC References
Professional traders don't just look at one VPOC. They reference multiple:
| VPOC Reference | Use Case |
|---|---|
| Prior Day VPOC | Primary reference for day trading |
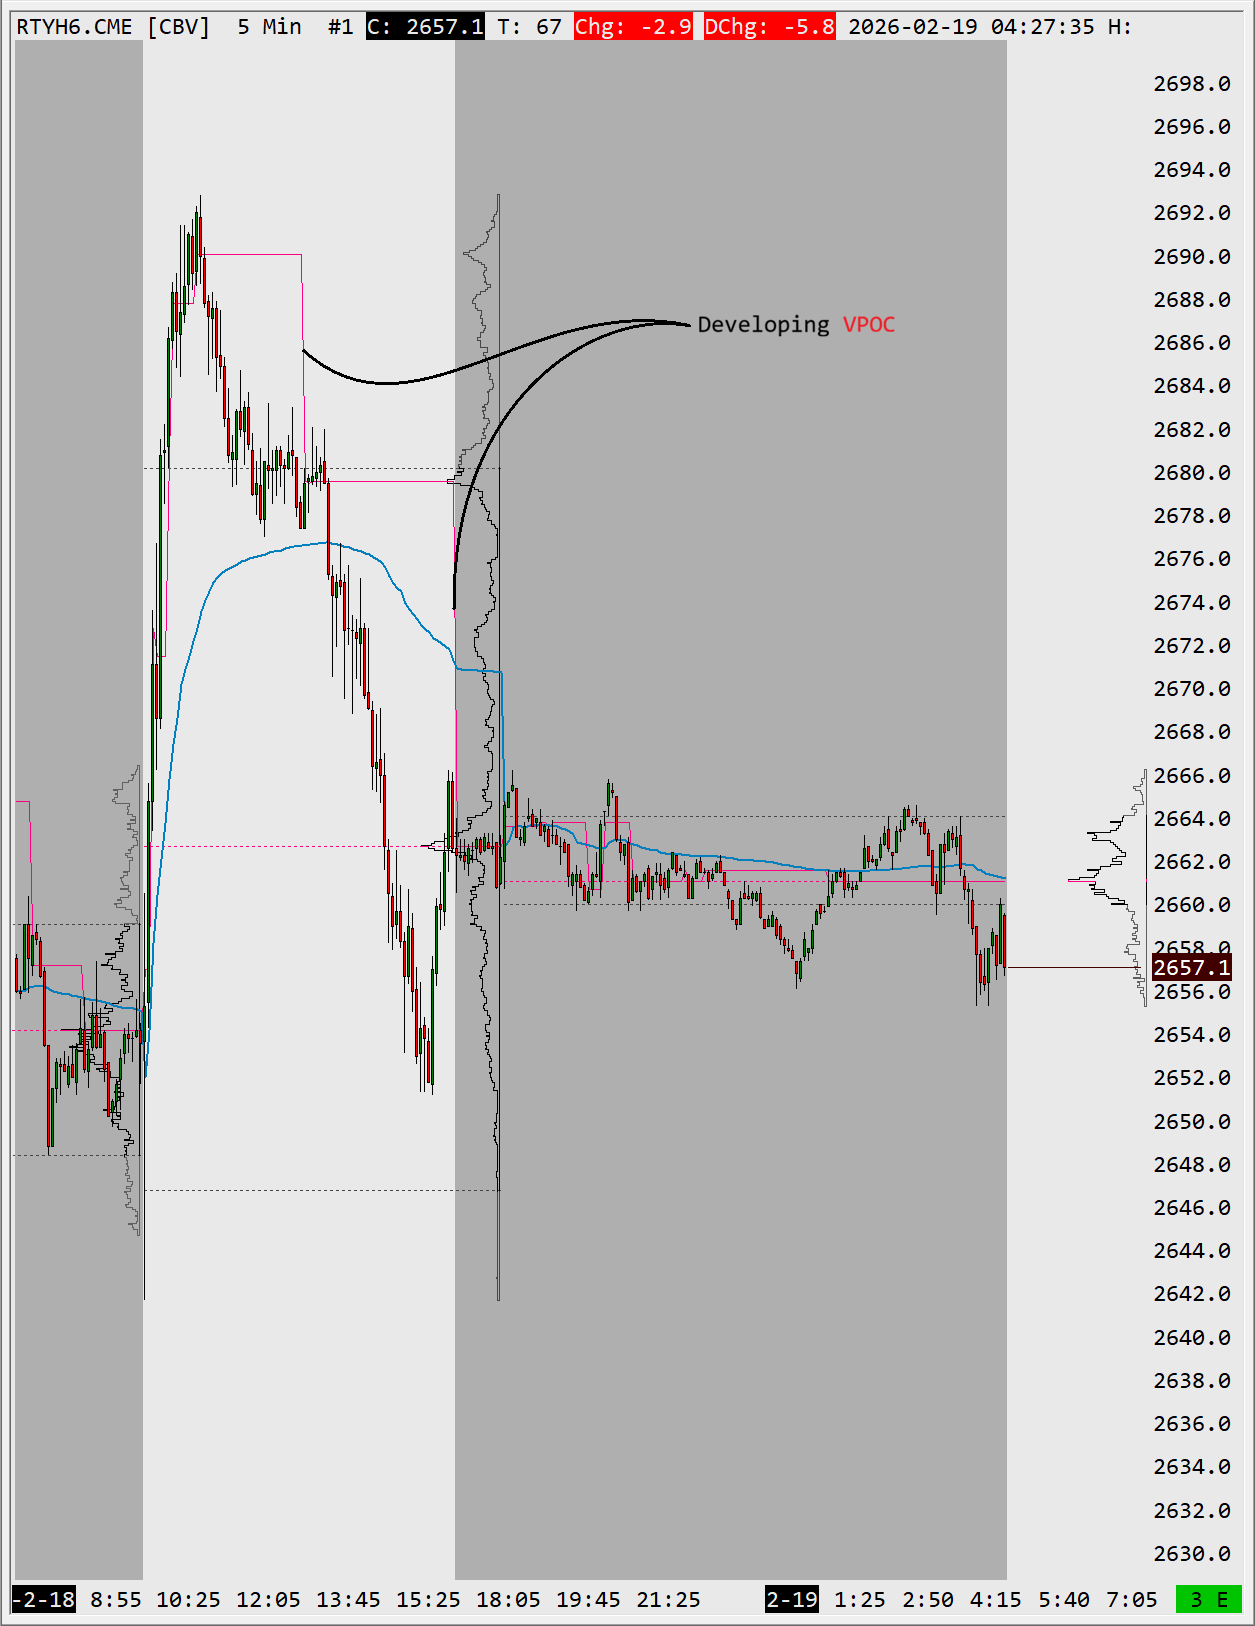
| Developing VPOC | Current session's evolving fair value |
| Weekly VPOC | Swing trading context |
| Composite VPOC | Multi-day composite for trend context |
When multiple VPOCs cluster near the same price, that level becomes even more significant — it's a confluence zone where multiple sessions agreed on fair value.
Common VPOC Trading Mistakes
Mistake 1: Trading VPOC in Isolation
VPOC alone doesn't tell you direction. It needs context from other levels (VAH, VAL, overnight range) and from the current open type. A VPOC test during a trend day behaves very differently from a VPOC test during a balance day.
Mistake 2: Assuming VPOC Always Holds
VPOC is a statistical tendency, not a guarantee. Some days, price slices through VPOC without pausing. The key is understanding when it's more likely to hold (inside days, value area opens) versus when it's likely to break (trend days, gap openings).
Mistake 3: Ignoring Developing VPOC
The developing session's VPOC shifts as new volume prints. If the developing VPOC migrates toward the prior VPOC, that's a convergence signal. If it moves away, the market is establishing a new fair value.
VPOC Statistics: What the Data Shows
Based on real ES data (~1,337 sessions), prior VPOC is tested in 58.5% of all sessions — but this average hides the full picture. The actual rate varies widely by open type, as shown above. VPOC tests are most reliable on in-range opens (HIR/LIR at ~69%) and least predictable on gap opens (LOR at 33%, HOR at 42%).
Additional observations:
- VPOC tests often occur during the first 2 hours of RTH
- When VPOC is NOT tested on an in-range open, the session is more likely to be a trend day
- VPOC as support/resistance has higher reliability when aligned with a value area boundary
This is why context-aware statistics — where test rates are broken down by open type — are far more actionable than blanket averages. StatLevels Suite displays these numbers directly on your chart.
Key Takeaways
- VPOC is the price with the most volume — the market's consensus fair value
- It acts as a magnet — untested VPOCs tend to get tested
- Context matters enormously — VPOC reliability changes with open type
- Multiple VPOCs create confluence — cluster zones are high-value reference areas
- Don't trade it in isolation — combine with VAH, VAL, and current session structure
- Track the statistics — know the actual test rates for your contracts under different conditions
Frequently Asked Questions
What is VPOC in trading?
VPOC stands for Volume Point of Control — the single price level where the most volume traded during a session. It marks the market's consensus "fair value" for that session and sits inside the value area, between the Value Area High (VAH) and Value Area Low (VAL).
What is the difference between VPOC and POC?
They refer to the same concept measured differently. POC (Point of Control) traditionally comes from a TPO / Market Profile and is the price with the most time-based activity, while VPOC is derived from a volume profile and is the price with the most traded volume. On most charts the volume-based VPOC is the one traders watch because it reflects where contracts actually changed hands.
Is VPOC support or resistance?
Both, depending on which side price approaches from. An untested VPOC tends to act as a magnet that price gravitates back toward; once price reaches it, the VPOC often becomes support on the way down or resistance on the way up. Its reliability depends heavily on the session's open type and surrounding structure.
How do you trade VPOC?
The most common uses are as a target (fade extremes back toward VPOC on balance days), as support/resistance (look for reactions when price tests an untested VPOC), and as a context filter (price above VPOC favors longs, below favors shorts). It works best combined with VAH, VAL and the day's open type rather than in isolation.
Ready to upgrade your trading?
Discover our professional tools for Sierra Chart.